Economy and business
The reality of Italian public expenditure from 2006 to 2022
Often, when people talk about Italy, they talk about excessive and ever-growing public spending, the need for cuts, ever-pressing austerity, and waste, as if this were the original sin of the Belpaese.
In this short post, we want to give you some idea of how things actually are using a nice graphic by Canalesovranista, which is pleased to offer some good elaboration on the actual data and give some material for the mind.
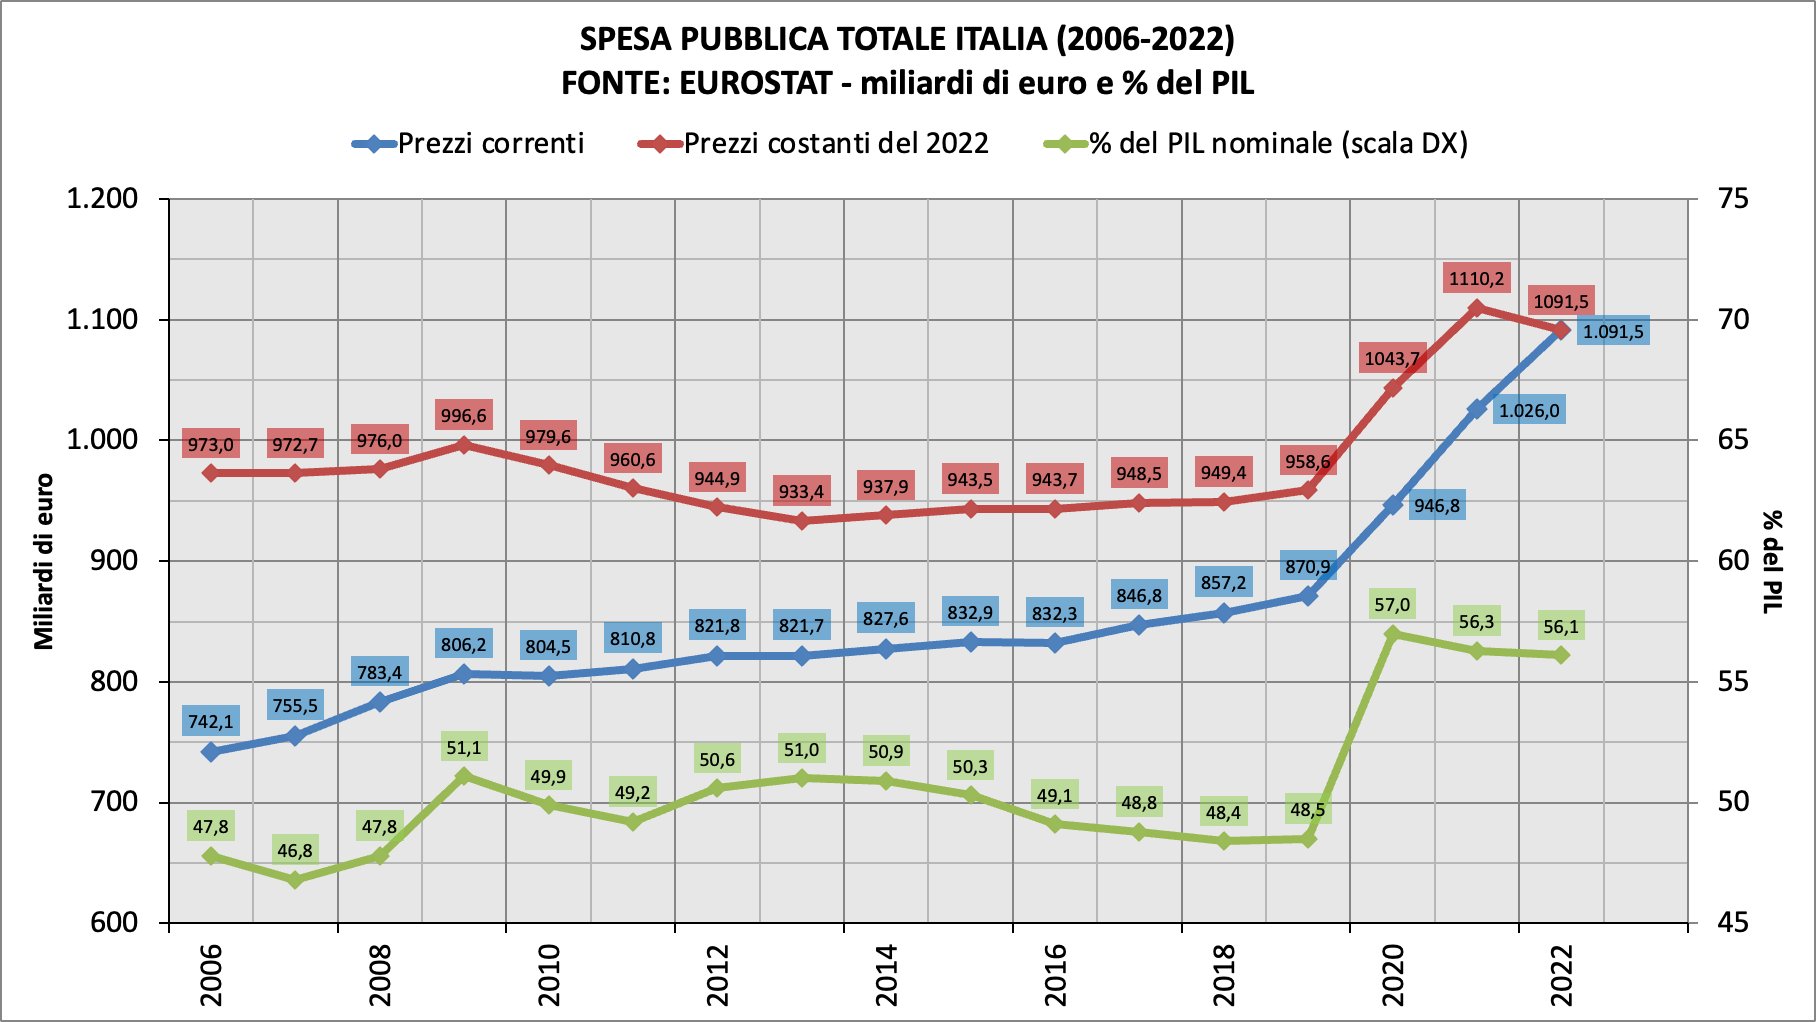
Green: public expenditure in relation to nominal GDP. In blue Public expenditure at current prices. In red, public expenditure has constant prices 2022
Actually, until the pandemic that somewhat turned the tables by changing many paradigms, government spending had been declining relative to PIl since 2009 and , practically, stable, as real spending
There was a sharp decline even before the Monti government, starting with the last Berlusconi government, in real terms by 2022.
If we analyze the growth of GDP compared to public spending since 2006, perhaps the only government that, for a short time, managed to have a slight increase in GDP with public spending cut was the Berlusconi/Tremonti government, but the reality, the growth of 2010–2011 was but a rebound from the fall of the financial crisis of 2009
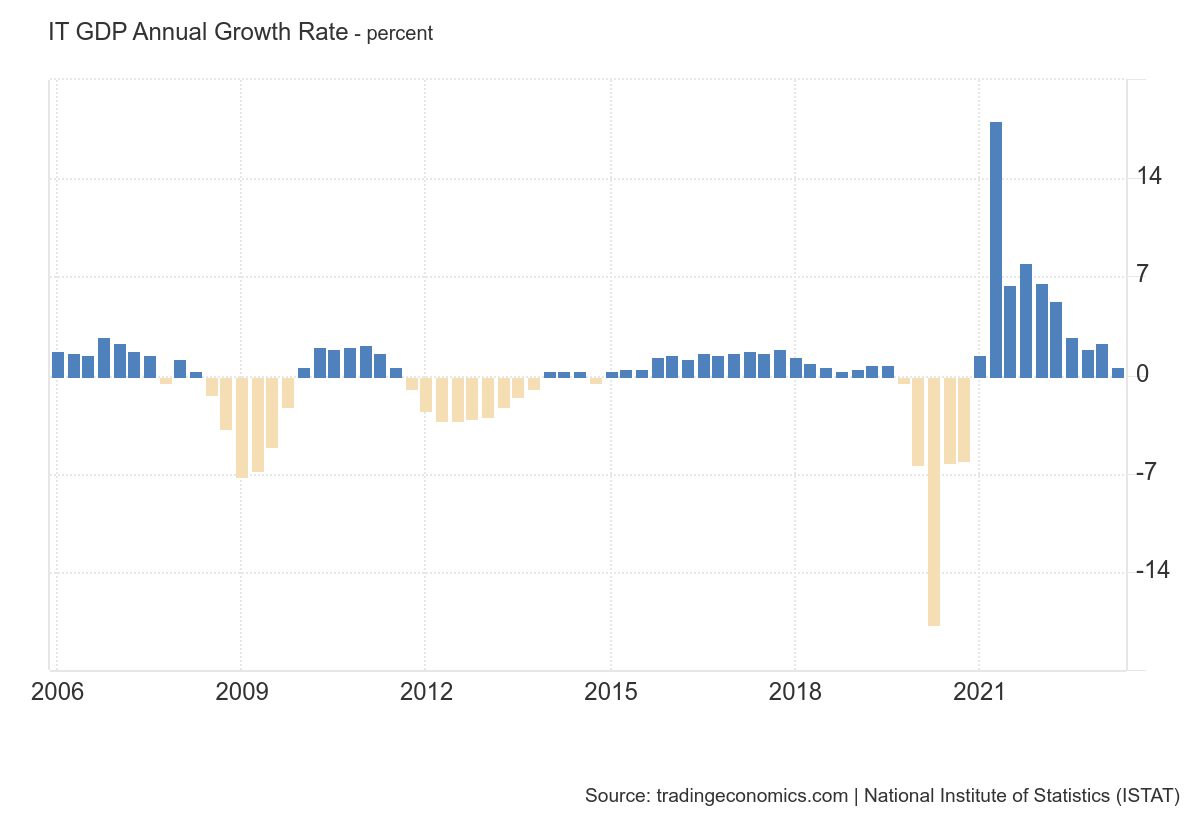
Otherwise, Monti’s public spending cut sent us into recession, and the modest growth in subsequent public spending was accompanied by weak economic growth. By itself, the economy is not growing, and that should make one think a lot about the function of spending itself and what would really be needed by the real economy. Then came the pandemic, and things changed a bit, but not heads.

Juventus between Saudi Sirens and the Shadow of Tether: Exor resists the €2 Billion, but the Market bets on weakness

Russia, a Bitter Start to 2026: Oil Revenues Plunge 50%. Global Prices Will Decide the Budget’s Future

Juventus: Exor’s “No” sends the token crashing. Are Fans rejecting Elkann’s entrenchment?

Not just offshoring: the revival of genuine Made in Italy jeans (handmade in Veneto)
